What is Measure of Central Tendencies
Measure of central tendency is a value which describe the central position of the data from several angle or direction.
there are three measurement for central location (measure of central tendency) of a dataset.
- Mean also known as average value of the dataset from first index to last index.
- Mode - show the most frequent data value within the datasets from first index until the last index.
- Median - data value that locate on the center of dataset sets index. if the datasets length is even, the median is the average value of two position on the central.
— its often called mesaure of central tendencies as summary statistics of a dataset.
The importance to find Measurement of central tendencies on a dataset
the first door of data analysis as summary statistics (result of the central tendency measure) is the fundmental information needed in order for analyzing the data.
Quick Gimpse about the Data to discuss about business decision
a Measurement of central tendencies can give quick insight about the dataset by looking at the trend. Judgement can be made once mean, median and modes are identified.
measure of central tendencies is powerful punchline on any pitch. our sales drop by 50% will make a solid pain point to make decision.
for example, a dataset of students test score of math subject from class A-1
total population = 30.
- mean = 50
- median = 60
- modes = 55
from the above summary statistics alone, it can be implied that students at class A need supplementary class as most of them can’t pass the bareminimum threshold (assuming the threshold is 75).
— to be fair its actually either the student need to be put on supplementary class or the teacher need to be replaced as the most student are failed.
Finding outlier data
the value difference between mean-median, mean-modes, mode-median could be indicating data issue / outlier. Also known as skewed data where the data distribution is not balanced especially if the difference is too high.
Baseline for further analysis
each computation has its own best practices. for example: the line of best fit during regression computation is calculate dusing mean (average).
When to compute measurement of central tendency
it is mandatory to compute the measurement of central tendency (mean, median, modes) during several stage of data science process.
- Data Cleansing: not needed, as this is more based on business rules. for example, latitude and longitude value has certain predefined range(lat/south-north to equator: -90 to +90, long/east-west to equator: -180 to +180). if the data not fall under the coordinate range meaning the data is not valid and need to be cleaned, adjusted or removed (depend on the scenario).
- EDA: measure of central tendecies is the first step needed during exploratory data analytics. It will tell the data distribution quality (balance or not balance) and detect the skew/outliers. Ensure the skew/outlier is solved before move to the training phase.
- feauture engineering: if skew/outlier is found, the data need to be normalized/scaled to ensure the distribution is normal.
Formula to Compute the Measurement of Central Tendecies
below are the formula to compute each of the central tendencies data point
Compute MoT:Mean
Mean or also known as average can be applied to the discrete data and continuous data.
On a histogram (a barchart that show data distribution frequency), mean is the highest bar as the Y axis of histogram is number of data frequency (how many index with given value)
— Mean value is equal to the sum of all data and divided by number of the population
Mathemtical formula
\[\bar{x} = \frac{\sum_{i=1}^{n} x_i}{n}\]Where as:
- \bar{x} = x bar, mean value
- n = total data points or number of data points
for example, we have following students exam score data
studentScore = [55,56,35,77,22,33,99,23,45,66,77,89,95,100,23,34,55,88,99,85];
numberOfDataPoint = len(studentScore);
print(f"total number data point or array elngth : {numberOfDataPoint}")
it is recommended to compute MOT (measure of tendency) using Numpy (and convert the dataset/array into numpy array) to improve the computation performance as numpy array is stored on memory and cached.
find MOT Mean using python
studentScore = [55,56,35,77,22,33,99,23,45,66,77,89,95,100,23,34,55,88,99,85];
numberOfDataPoint = len(studentScore);

print(f"total number data point or array elngth : {numberOfDataPoint}")

# convert array to NumpyArray

import numpy as numpy

studentScoreNP : numpy = numpy.array(studentScore)
mean = studentScoreNP.mean()

print(f"mean: {mean}")
numpy package need to be installed first before above code can be executed
pip install numpy
above code will return the average score (which is 62.8)

Compute MoT:Median
median is the middle score for a dataset that has been arranged ordered (usually from lower to higher).
steps
- sort the array/dataset from lower to higher data point value
- calculate the median, if odd the median index is (n-1/2), if even avg(indexValue(n/2)+indexValue(n/2)+1)
it is recommended to use Numpy to compute median as above steps already available as built in function on numpy.
median can be computed using following formula
if the n (number of data points) is odd :
value of array index number : (n-1/2)
or on mathematical equation format
\[\text{value at index} (n - \frac{1}{2})\]if the n is even
average value of (index number (n/2) + index number (n/2)+1))
or on mathematical equation format
\[\frac{ \left(\text{value at index }\frac{n}{2}\right) + \left(\text{value at index }\left(\frac{n}{2} + 1\right)\right) }{2}\]find MOT median using python
studentScore = [55,56,35,77,22,33,99,23,45,66,77,89,95,100,23,34,55,88,99,85];
numberOfDataPoint = len(studentScore);
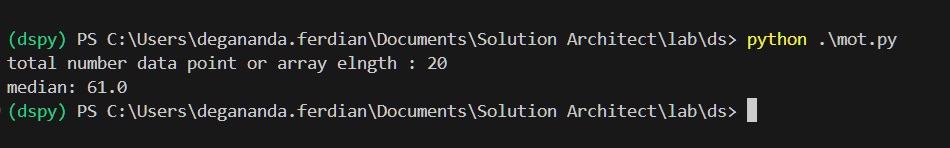
print(f"total number data point or array elngth : {numberOfDataPoint}")
# convert array to NumpyArray
import numpy as numpy
studentScoreNP : numpy = numpy.array(studentScore)
median = numpy.median(studentScoreNP)
print(f"median: {median}")
result
Compute MoT:Mode
— Most frequent value on the dataset.
mode can be computed by counting the number of array indexes that has same value. Hover ever numpy doesnt have built capability to compute mode value of an array.
Fortunately there is library called SciPy that compatible with Numpy Array (as we wanted all numeric dataset to be put on numpy data format) to compute the mode
install scipy
pip install scipy
use following python script
studentScore = [55,56,35,77,22,33,99,23,45,66,77,89,95,100,23,34,55,88,99,85];
numberOfDataPoint = len(studentScore);
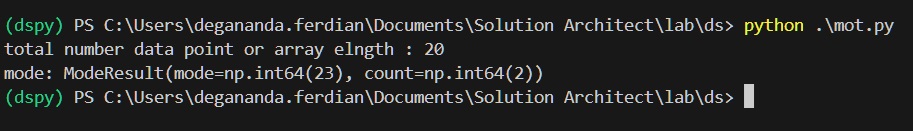
print(f"total number data point or array elngth : {numberOfDataPoint}")
# convert array to NumpyArray
import numpy as numpy
import scipy.stats as stats
studentScoreNP : numpy = numpy.array(studentScore)
mode = stats.mode(studentScoreNP)
print(f"mode: {mode}")
it will compute the mode value